According to Blask‘s data, the World Cup didn’t create much new demand. It moved existing demand around: between countries, between days, and, as Blask’s new Match Profitability Index shows for the first time, between bookmakers and bettors.
These findings are part of Blask’s newly released WC2026 report: https://blask.com/reports/world-cup-2026/
The tournament redistributed attention more than it grew it
Blask tracked World Cup-related search interest separately from betting-brand demand, via its World Cup Index, a daily, country-level read on tournament buzz.
That index climbed through the group stage and peaked on July 4, US Independence Day, which also fell on a Round of 16 weekend. It cratered on July 8, the tournament’s first match-free day, and hit its lowest point of the whole window on July 17, two days before the final, which itself drew roughly 49% more attention than the tournament’s opening day.
Group-stage days averaged 15% higher World Cup Index than knockout days: more matches and more teams still in the picture beat the drama of a smaller bracket.
Betting-brand demand (Blask Index) followed a similar shape: it peaked June 13, the first full Saturday of the group stage, and bottomed out July 13, a rest day between the quarter- and semifinals. Group-stage days ran 5.6% above knockout days per match-day average.
Read together, both metrics point to the same conclusion: the World Cup’s demand center of gravity sat in the group stage, well before the final kicked off.
Hosting doesn’t buy loyalty once your team is out
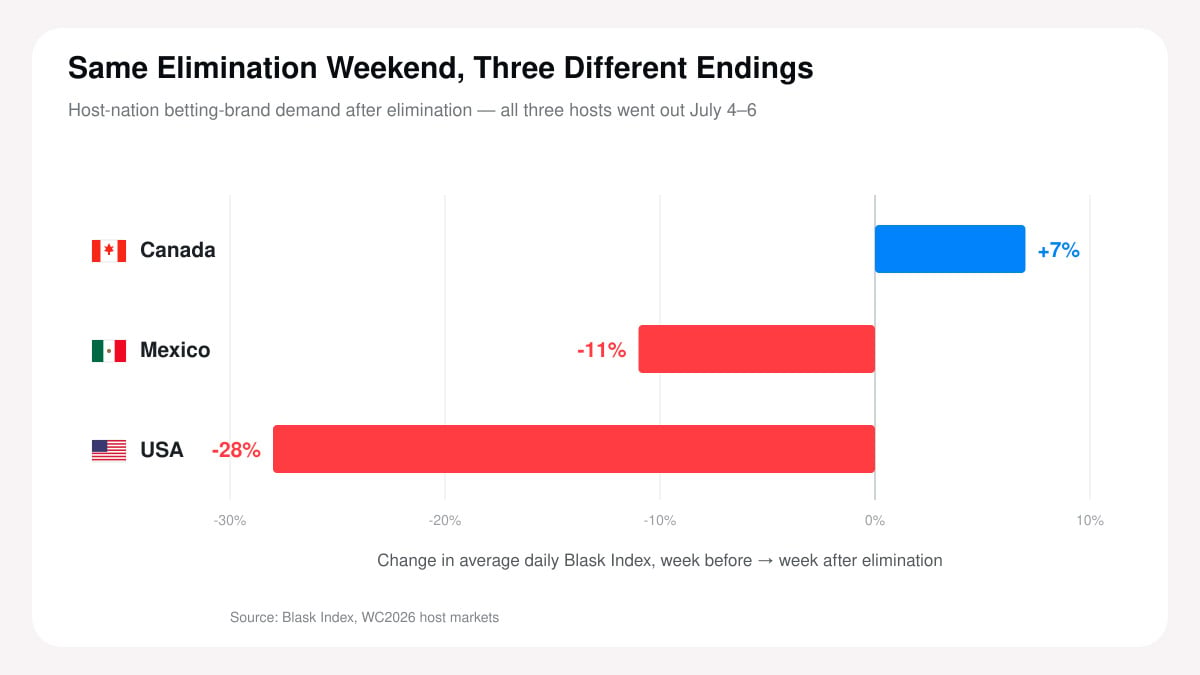
All three host nations, USA, Mexico, and Canada, reached the Round of 16 and went out within days of each other, July 4-6.
The three hosts diverged sharply from there. US betting-brand demand fell 28% after elimination, from roughly 256,000 to 185,000 average daily Blask Index. Mexico’s post-exit drop was milder, 11%. Canada’s demand rose 7% after its own team was out, the only host market of the three to hold or grow interest once it had nothing left to root for.
Total Blask Index over the tournament window came in close across the three hosts (USA 9M, Mexico 9.5M, Canada 9.7M), which frames the post-exit divergence as a story about retention, not raw scale: the three hosts started from a similar-sized audience and ended in three different places.
Who profited: the Match Profitability Index
This is where Blask’s data breaks new ground. Blask scored every one of the tournament’s 104 matches not on who won the game, but on who won the market, combining a prematch score (closing-odds movement and implied win probabilities ahead of kickoff) with a live score (how the seven most-bet in-play markets, 1X2, Total Over 2.5, Team Total Over, Quick Goal, Goal after 75′, Favorite Comeback, and 0-0, moved against what a bookmaker would expect). A positive combined score means the match was profitable for the book; negative means players won more than the market had priced in.
Across all 104 matches, the aggregate score came in net negative: the tournament, as a whole, was more bettor-favorable than bookmaker-favorable. Market by market, only one, the 0-0 scoreline, stayed cleanly profitable for books across the tournament.
Nearly every other live market bled money for bookmakers in aggregate, and one in particular did most of the damage: Total Over/Under 2.5 goals, more than five times as costly to books as the next-worst market (1X2).
Across the dataset, the biggest single-match losses for bookmakers cluster on the pre-match side of the ledger. The money that hurt the books most had already moved before kickoff; live betting mostly amplified swings that pre-match staking had already set in motion.
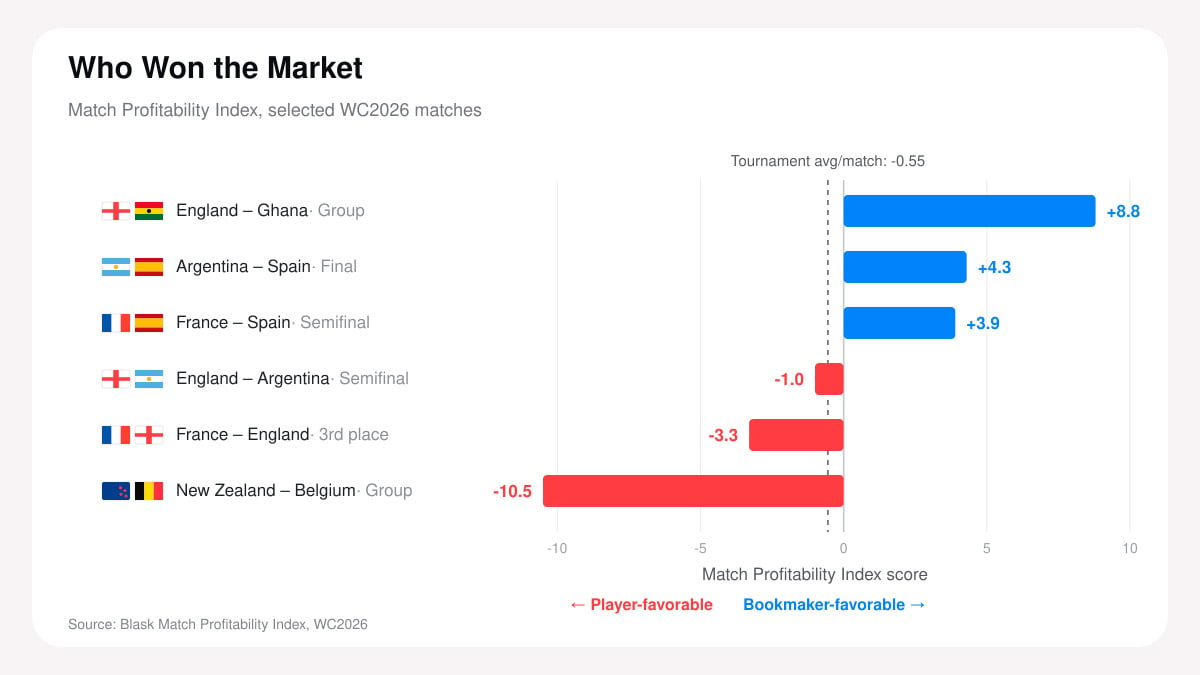
The two extremes illustrate the mechanism.
England-Ghana, a surprise 0-0, was the tournament’s single most profitable match for bookmakers (+8.8), with a strong prematch position and a live market that kept moving in the book’s favor, live slightly ahead of prematch.
Nearly every market swept the same direction. New Zealand-Belgium, a 1-5 Belgian win, was the most costly (-10.5). Both phases lost money, but Total 2.5 alone (-6.5) did most of the damage, the biggest single-market loss recorded across the tournament.
The knockout rounds split the same way. In the semifinals, France-Spain ran +3.89 for bookmakers, driven almost entirely by the Total 2.5 market as Spain’s 2-0 win handed the book a low-scoring outcome it had priced favorably. England-Argentina ran the opposite pattern: a positive pre-match position (+1.7) got clawed back to -1.00 once live betting moved against the book during the match, a rare case where in-play trading decided who won the market.
The final itself, Spain’s 1-0 extra-time win over Argentina, was Blask’s most bookmaker-favorable close-tournament match at +4.35. Prematch was a small loss (-0.15); live betting alone generated the entire profit and then some. The third-place playoff went the other way. England beat France 6-4 (-3.26), with Total 2.5 again the market that hurt bookmakers most, in a match that produced ten combined goals against pre-match expectations.
What this means for operators
WC2026 confirms three separate signals that most tournament recaps conflate: how much people search for a brand, how much they wager, and who keeps the money once the bets settle.
Blask’s data shows all three moved differently.
Demand redistributed more than it grew. Hosting a tournament didn’t guarantee lasting interest once the home team was out. Canada held its audience better than the US did, despite an identical group-and-knockout run.
The market itself, scored match by match rather than assumed from handle totals, came out net player-favorable, with the Total Over/Under goals market doing far more damage to bookmaker margins than the marquee 1X2 line. For operators planning around the next major tournament, that’s the useful part: a book pricing Total Over/Under lines for 2027 already has data on which market bled margin this time.
Related reading: European iGaming markets after the 2026 tax rises and ad bans and Live games in 2026: the titles and countries leading the market.
Explore Blask in the NYCE Product Marketplace, or contact NYCE to discuss an introduction.
Originally published in the NYCE Marketplace section on Yogonet on September 3, 2026.